The following poster discussing ProtoFit's general methodology and applications was presented at the 15th Annual V.M. Goldschmidt Conference in Moscow, Idaho on May 24, 2005. It is reproduced here in html form for your convenience.
Turner, B. F., and Fein, J. B. (2005). A derivative method for analysis of surface potentiometric titration data and model optimization. Geochim. Cosmochim. Acta, 29 no. 10, suppl.1, p. A49.
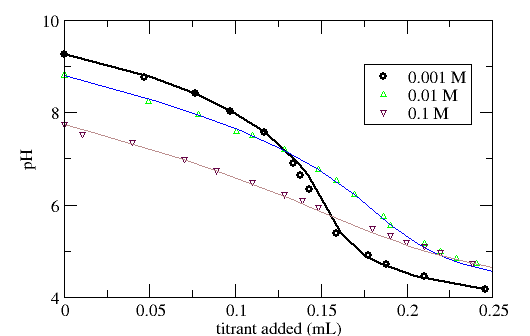
Requires that the initial proton charge of the adsorbent be either known (which is not practicable for many substances) or treated as an adjustable parameter.
This presentation reports a method of titration data analysis that overcomes the above barriers to data visualization and comparison, and can optimize models in a way that is independent of starting pH and initial proton charge.
Calculation of the buffer function Q*ads
The buffer function Q*ads is the resistance the adsorbent provides to changes in solution pH. It is obtained by first calculating the moles of protons exchanged with the adsorbent at each titration data point:

then calculating the slope (derivative) of this function, normalized to adsorbent mass:


where b0, b1, b2 are coefficients for a polynomial fit to a portion of the curve, and x represents pH.
Interpretation of the adsorbent buffer value Q*ads
The adsorbent buffer value Q*ads represents the pH buffering behavior of the adsorbent sought in the titration. Since the function is independent of adsorbent/water ratio and starting pH, it is ideal for comparing titration data collected under different conditions.

Figure 2. Titration data of TiO2 in the form of the Q*ads function. Dataset is the same as in Figure 1.

Figure 3. Titration data of bacteria compared using the Q*ads function (Borrok et al., 2005).
Visualization using Q*ads can yield useful insights into the appropriateness of a given model. In the example below, the model appears to simulate the titration curve reasonably enough, but clearly does not capture the observed adsorbent buffering behavior well.


Figure 4. Titration data of Al2O3 particles. (a) Comparison of raw titration data with simulated titration (solid line) using fitted DLM. (b) Comparison of observed and model buffering behavior. Data and model from Hayes et al. (1991)
Optimization of Surface Complexation Models
The general approach to model optimization is to minimize a weighted sum of squares between the observed Q*ads and the equivalent model buffer value F*ads.

Optionally, the uncertainty in Q*ads can be used to weight the sum of squares such that poorly constrained data points are given less weight. V(Q*ads) is the variance obtained from the polynomial regression used to calculate Q*ads, and w is a weighting parameter. The general approach can also be modified to include model pHzpc as a constraint.
Software Implementation
Our algorithm is implemented in the computer program ProtoFit. Also developed is a user-friendly interface ProtoFit-GUI. ProtoFit can calculate Q*ads, optimize models, and run simulated titrations based on model behavior.

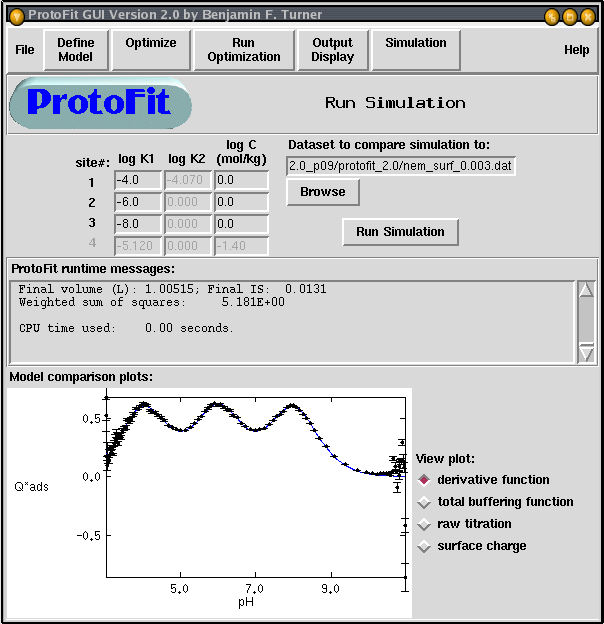
Figure 5. Screenshot of simulation window in ProtoFit-GUI. Interface provides for rapid visualization of data, including comparisons of data to model simulations of Q*ads and raw titration. Error bars indicate the standard error of Q*ads .

Figure 6. Visualization of the total buffer function Q*tot is useful for evaluating experimental design and relative strength of the adsorbent buffer signal.
Models that can be currently optimized by ProtoFit 2.0 include the non-electrostatic, double layer, constant capacitance, and Donnan shell models. Virtually any SCM could potentially be optimized by this approach.
ProtoFit and ProtoFit-GUI are Free Software licensed under the Gnu General Public License. Software and documentation can be downloaded from http://protofit.sourceforge.net.
Acknowledgement
Funding for this work was provided by a NSF Environmental Molecular Science Institute grant (NSF-EAR-0221966).
References
Borrok, D., Turner, B. F., Fein, J. B., 2005. A universal surface complexation framework for modeling proton binding onto bacterial surfaces in geologic settings. Am. Jour. Sci. (In Press).
Hayes, K. F., Redden, G., Ela, W., Leckie, J. O., 1991. Surface complexation models: an evaluation of model parameter estimation using FITEQL and oxide mineral titration data. J. Colloid Interface Sci. 142, 448-469.
Turner, B. F., 2005. ProtoFit Version 2.0, a Program for Determining Surface Speciation Constants from Titration Data: User's Manual. Dept. of Civil Engineering and Geological Sciences, Univ. of Notre Dame, Notre Dame (27 pp.).
Benjamin Turner
Last modified: Fri May 27 17:07:45 EST 2005


